Welcome to the third part of my series on observability engineering! The first part can be found here, and the second part here. I hope this series proves useful to you, and I’m excited to continue working on the upcoming posts!
Introduction
You know the score by now and I won’t delve into a full explanation or analogy of observability engineering again (for a refresher, please check out the first post in the series), but let’s quickly recap. Observability engineering involves measuring the internal states of a system or application by examining its outputs. It’s straightforward – no secret sauce, and no hocus pocus! In this series, we’ll cover important topics within observability engineering that should benefit both newcomers and seasoned engineers alike.
I like to have my opinions challenged and changed by healthy discussion.
Pillar Three - Tracing
What is tracing?
In modern distributed systems, particularly those built on microservices or serverless architectures, different services often need to interact with each other to fulfil a single user request. This interconnectedness makes it incredibly challenging to identify performance bottlenecks, diagnose issues, and analyse overall system behaviour. The difficulty is amplified when these services span multiple domains and are managed by different teams.
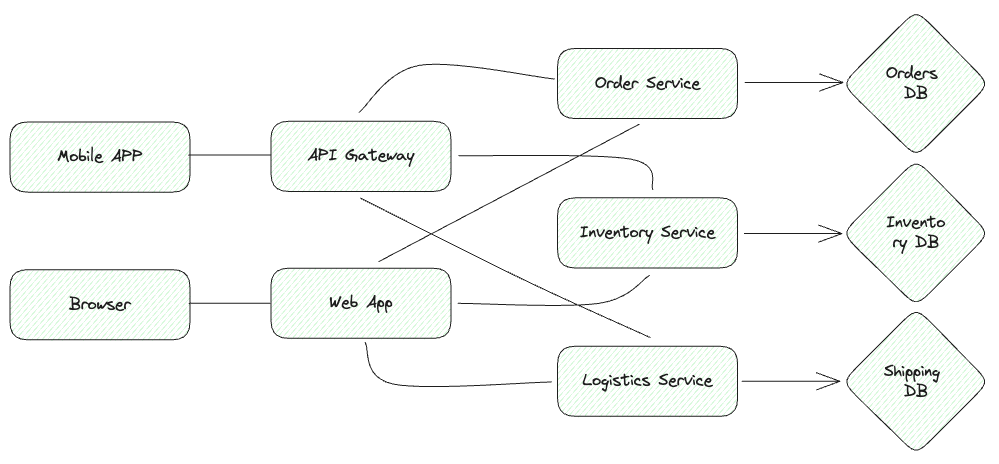
Consider a simple example of an online bookstore. Zod, the senior engineer on the orders team, notices that requests are timing out. His team is responsible for the orders microservice, which interacts with the inventory microservice to check the stock of an item during checkout. After receiving the stock information, the orders service places an order by sending another request to the inventory service. The inventory service then contacts the logistics service to get an estimated delivery time. However, unbeknownst to Zod and his team, the logistics service recently made some changes to their backend queries and inadvertently missed some crucial index updates in their NoSQL database. As a result, queries to the logistics service’s database are taking much longer than usual, ultimately causing the orders service to time out because it can’t provide the user with a delivery ETA.
I know, I know—it’s clear I’ve never worked in the orders or logistics domains before, but you get the point. In distributed systems supported by multiple teams, often across different domains, pinpointing the root cause of an issue like this would be nearly impossible without tracing. In my opinion, of the three main pillars of observability, tracing is the most crucial.

The anatomy of traces and spans
To keep it very simple, a trace consists of a series of interconnected spans. Each span represents an individual operation or activity within a specific service or component, ie. a database query like SELECT product_description, product_stock_count FROM Inventory WHERE product_id="xxxxx". The crucial piece of information about tracing and the passing of requests is that when a request enters a service or component, the trace context is propagated along with the request. This usually involves injecting trace. headers (including the trace_id) into the request, allowing downstream services to participate in the same trace.
Right, I am going to do my obligatory thing in this series and mention OpenTelemetry again. Deal with it! But seriously, the easiest and most standardised way of getting started is to pick an OpenTelemetry APM and off you go. Most modern vendors (ie. Datadog, Sumologic, Honeycomb) will provide exporters and well tested documentation.
Let’s quickly cover the make up of spans, the core component of a trace. A span represents an operation (or a unit of work) in a trace. A span could be a database query, or an in-process function call, or even a remote procedure call (RPC). A span has all of these things:
- A span name (operation name).
- A parent span.
- A span kind.
- A start and end time.
- A status that reports whether operation succeeded or failed.
- A set of key-value attributes describing the operation.
- A timeline of events.
- A list of links to other spans.
- A span context that propagates trace ID and other data between different services.
A trace is a tree of spans that shows the path that a request makes through an app. The root span is the first span in a trace. An example:

Now, time for some sage advice. All OpenTelemetry backends use span names and some attributes to group similar spans together. To group spans properly, I highly recommend giving them short and concise names. You should aim to have less than 1000 unique span names, for performance reasons. Let’s look at some good and bad span names:
Good
| Span Name | Comment |
|---|---|
| GET /orders/:id | Good. A route name with param names. |
| select_order | Good. A function name without any args! |
| SELECT * FROM orders WHERE id = ? | Good. A database query with placeholders. |
Bad
| Span Name | Comment |
|---|---|
| GET /orders/1 | Bad. Contains a variable param of 1. |
| select_order(1) | Bad. Contains an argument of 1. |
| SELECT * FROM orders WHERE id = 1 | Bad. Contrains a variable of value 1. |
Lastly on spans, every span must have a kind/type, and it must be one of these values:
serverfor server operations, for example, HTTP server handler.clientfor client operations, for example, HTTP client requests.producerfor message producers, for example, a Kafka producer.consumerfor message consumers and async functions, for example, a Kafka consumer.internalfor internal operations.
…also, spans must have a status code of one of the following values:
ok- success.error- failure.unset- the default value which allows the backends to assign the status.
Some additional features of traces and spans
Attributes
If you wish to record contextual information, you can annotate spans with attributes that carry information specific to the operation. Let’s give a basic example such as a HTTP endpoint, which may have attributes like http.method = GET and http.route = /orders/:id.
You have the freedom to name attributes as you want, but for common operations you should use the OpenTel semantic attributes convention.
Events
You have the option to annotate spans with events that have a start time and an arbitary number of attributes. The main difference between events and spans is that events don’t have an end time (and therefore no duration).
Events can usually represent exceptions, errors, logs, and messages (such as in RPC), but you can also create custom events if you so wish. For example, you may have a telemetry wrapper that your engineeing team uses to annotate spans in a standardised way, including sending your logs via tracing as well.
The observant of you may remember back in my first post in this series, you will note that the first pillar of observability is on Logs. So, if you can send event-logs via spans in a trace, why do you need logs as a seperate pillar? Well, the simple answer is, you probably don’t. However, not all systems architecture is created equally, and through acquisitions or divergent paths in your tech choices, you may still want to collect logs from different components. So, if your tech stack is fairly simple, and you just instrument your code to send traces to your backend/observability platform of choice, then you can likely just stick with this approach.
Context
Context is an important feature of spans. The span context carries information about the span as it propagates through different components and services in the tree.
The trace/span context is a request-scoped data object such as:
Trace ID. A globally unique identifier that represents the entire trace or query. All spans within a trace have the same trace ID.Span ID. A unique identifier for the specific span within a trace. Each span within a trace has a different span ID.Trace flags. Flags that indicate various properties of the trace, such as whether it’s sampled or not. Sampling refers to the process of determining which spans should be recorded and reported to the observability backend.Trace State. An optional field that contains additional vendor or application-specific data related to the trace.
The span context is incredibly important for maintaining the continuity and correlation of spans within a distributed system. It allows different services and components to associate their spans with the correct trace and provides true end-to-end visibility into the flow of requests or transactions. The span context is typically propagated using headers or metadata of the communication protocols between services, similar to how baggage data is propagated, which we will cover in a minute. This is to make sure that when a service receives a request, it can extract the span context, and associate the ingress span with the correct trace.
You can use data from the context for spans correlation or sampling. For example, you can use the trace_id to know which spans belong to which traces, which is obviously incredibly important during troubleshooting or sampling!
Lastly on context, read up on context propagation from the OpenTelemetry docs here. There is a section on supported serialisation and deserialisation protocols on that page as well, which is helpful!
Baggage
We all come with baggage, and fortunately so does tracing! Baggage allows you to propgate custom key:value pairs (attributes) from one service to another. The example on the OpenTelemetry documentation is fantastic, so I won’t give another - just have a read.
What should we instrument then and how?
You really do not need to instrument every operation in your code to get the most out of tracing - it would be very time consuming and it’s not really necessary, or even valuable for your observability practices. Consider prioritising these operations:
Network operations, for example, HTTP requests or RPC calls.Filesystem operations, for example, reading/writing to files.Database querieswhich combine network and filesystem operations.Errors and logs, for example, using structured logging, which from my first post in this series.

Ok, so now a quick example in Golang before the wrap up!
Step 1. Let’s instrument the following example function where we are inserting a new order:
func insertOrder(ctx context.Context, order *Order) error {
  if _, err := db.NewInsert().Model(order).Exec(ctx); err != nil {
    return err
  }
  return nil
}
Step 2. Let’s wrap the operation with a span:
import "go.opentelemetry.io/otel"

var tracer = otel.Tracer("app_or_package_name")

func insertOrder(ctx context.Context, order *Order) error {
  ctx, span := tracer.Start(ctx, "insert-order")
  defer span.End()

  if _, err := db.NewInsert().Model(order).Exec(ctx); err != nil {
    return err
  }
  return nil
}
Step 3. Let’s record errors and set a status code:
import "go.opentelemetry.io/otel"

var tracer = otel.Tracer("app_or_package_name")

func insertOrder(ctx context.Context, order *Order) error {
  ctx, span := tracer.Start(ctx, "insert-order")
  defer span.End()

  if _, err := db.NewInsert().Model(order).Exec(ctx); err != nil {
    span.RecordError(err)
    span.SetStatus(codes.Error, err.Error())
    return err
  }
  return nil
}
Step 4. We should also record some contextual information with attributes:
import "go.opentelemetry.io/otel"

var tracer = otel.Tracer("app_or_package_name")

func insertOrder(ctx context.Context, order *Order) error {
  ctx, span := tracer.Start(ctx, "insert-order")
  defer span.End()

  if _, err := db.NewInsert().Model(order).Exec(ctx); err != nil {
    span.RecordError(err)
    span.SetStatus(codes.Error, err.Error())
    return err
  }

  if span.IsRecording() {
        span.SetAttributes(
            attribute.Int64("endorder.id", order.ID),
            attribute.String("endorder.description", order.Description),
        )
    }

  return nil
}
Let’s wrap it up
I hope you have found this blog post helpful, and if anything, you have some takeaway pointers to use in your observability practices. Let’s do a quick a list of the most important takeaways from this post:
- Use OpenTelemetry for your Tracing! You will not regret it one bit and most repetable vendors support OpenTel standards, which is fantastic!
- You probably won’t need logs as well as traces! As mentioned in the events section above, you can send event-logs in your span payloads, which means you won’t need to send log’s seperately. This is why I will always recommend collaborating inside your engineering team to come up with solid observability patterns, and even wrapper libraries to help with consistency across all of your services and systems.
- Context is really important when your request paths traverse many different services and components within your distributed architecture. Always populate the context and remember to check out the supported standards that OpenTel offers!
- Only instrument key components! We covered a database insert in our example, which is considered a key component to the service/system.
- Use Semantic Conventions! When you add instrumentation to your code, it is important to follow semantic conventions. This means using standardised attribute names, span names, and span tags as all defined within the OpenTel specifications. Doing so ensures consistency and interoperability across different instrumentation libraries and backends.
Thanks again for reading and I hope you’re looking forward to the next blog post in this series, which will be about centralised observability platforms (also labelled as backends).