Welcome to the second part of my series on observability engineering! The first part can be found here. I hope this series proves useful to you, and I’m excited to continue working on the upcoming posts.
Introduction
I won’t delve into a full explanation or analogy of observability engineering again (for a refresher, please check out the first post in the series), but let’s quickly recap. Observability engineering involves measuring the internal states of a system or application by examining its outputs. It’s straightforward – no secret sauce, and no hocus pocus! In this series, we’ll cover important topics within observability engineering that should benefit both newcomers and seasoned engineers alike.
As always, my strong opinions are based on extensive experience, but they are held lightly. I take great pride in my ability to change my views when presented with new information or different experiences.
Pillar Two - Metrics
What are metrics?
First, what are metrics? Metrics are simply the numeric representation of data measured over intervals of time. Using my pilot analogy from the first post, a commercial pilot needs real-time metrics to make informed decisions throughout a flight. This data is crucial for the pilot’s situational awareness. If it were in log format, the pilot wouldn’t have time to sift through detailed logs to get the necessary information, which could be disastrous!
For the airplane manufacturer, having historical numeric data points is essential for hypothesis-based investigations. For instance, if a new engine version is introduced, manufacturers might hypothesise that these engines run significantly hotter than previous models. By analysing historical data points, they can mark when the new engines were installed and validate or refute their hypothesis. Metrics might not explain why the engines run hotter, but they provide a clear picture of when and what.

The incredible value of metrics
My first piece of advice is, if anyone ever tells you that metrics are unnecessary in modern observability engineering, take a deep breath and firmly disagree. While it might not warrant drastic actions (unless they’ve committed equally heinous acts like stealing your lunch from the office fridge), it’s essential to remind them of the immense value numerical data points provide for single-pane-of-glass troubleshooting. Metrics offer an additional data dimension, giving you immediate, data-based insights.
For instance, imagine a service or application reporting numerous errors early on a Monday morning at 9am. Your service might emit a metric through a framework like python_gc_objects_uncollectable_total, and your cloud provider might collect a memory_utilised metric. These numerical data points are unique to metrics and cannot be easily derived from other observability pillars.
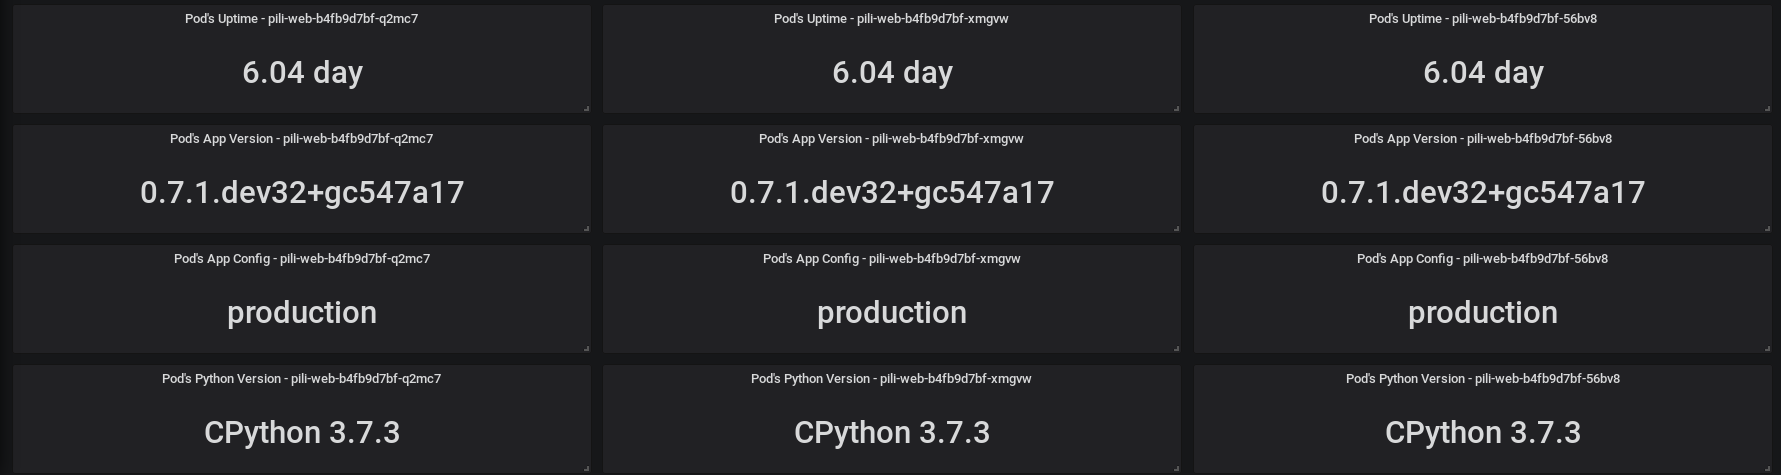
Now, consider Bob, the senior engineer, strolling into the office at 10am with his frappamochachino iced coffee and a croissant from his favourite bakery. Bob recalls a Python version bump on Friday afternoon, “but it had been tested and approved,” he mentions, mid-bite. What if Bob wasn’t there to provide that critical piece of information? No worries – you’re a super observability engineer who thought ahead and emitted a metric indicating the Python version of your service, such as python_version. Brilliant!
With this metric, you can easily correlate the version bump with the rise in uncollectable garbage collection objects due to increased request throughput on Monday morning. The team can then roll back the Python version, averting any major issues. Disaster mitigated.
I acknowledge this is a basic example, and something you might also catch in your logs, like SystemOutOfMemory exceptions. However, not all systems or services operate at the same scale. Engineers shouldn’t have to hunt for a needle in a haystack. So, always strive for clarity and precision in your observability practices.

Get collecting
Great stuff! We have covered how important metrics are, but what is the anatomy of a modern metric?
First of all, my strong opinion here is that you should pick OpenTelemetry to instrument and collect your metrics. Trust me and save a significant amount of time by making that choice early on. The OpenTel standards for metrics collection are supported by most major centralised observability platforms. We will cover centralised observability platforms in a future blog post.
The OpenTel metrics data model structure can be found here. OpenTelemetry has three models:
- The Event model, in which you instrument metrics as the software engineer
- The Stream model, which OpenTelemetry uses for transport
- The Timeseries model, which OpenTelemetry uses for storage
The OpenTelemetry metrics are constructed by using the global MeterProvider to create a Meter, and associating it with one or more instruments. An instrument is a specific type of metric (e.g., a counter, gauge, histogram) that you use to collect data about a particular aspect of your service or application’s behaviour. You capture measurements by creating instruments that are comprised of:
- A unique name, for example,
http.proxy.request.duration - An instrument type, for example, Histogram
- An optional unit of measure, for example,
millisecondsorbytes - An optional description for the instrument
A single instrument can produce multiple timeseries. A timeseries is a metric model with a unique set of attributes. For example, let’s say you have a Kubernetes cluster; each host in the cluster has a separate timeseries for the same metric name.
It’s very important to mention additive instruments at this stage. Additive or summable instruments produce timeseries that, when added up together, produce another meaningful and accurate timeseries. Additive instruments that measure non-decreasing numbers are also called monotonic. For example, http.server.requests is an additive timeseries because it can be summed from multiple hosts to get the actual total number of requests from your service if you load balance requests, which you should be doing, of course! There are also synchronous instruments, which are invoked together with the operations they are measuring. For example, +1 to a counter when a request is fired off for your service or application. Lastly, there are also asynchronous instruments, which periodically invoke a callback function to collect measurements. Asynchronous instruments are also known as observers, and observers can be used to periodically measure things like system memory or CPU usage.
When to use what type and some examples!
Some simple guidance on when to use what:
- If you need to measure
request_latencyor mayberequest_size, pick a Histogram - If you need to measure things like
processed_requests,errors,received_bytes,disk_reads, pick a Counter if the value is monotonic. Otherwise, use UpDownCounter as your instrument type - If you need to measure things like
cpu_time,memory_usage_bytes,memory_utilisation_percentage, if the value is additive/summable and if the value is monotonic, use CounterObserver; otherwise, use UpDownCounterObserver. Lastly, if the value is NOT additive/summable, use the GaugeObserver type.

Lets make this fun by doing a few examples! I’ve picked golang in the following examples, but there are well supported SDK’s/API’s in most popular programming languages. We want to measure the number of requests our startup app sends to social media API’s, so we should pick a Counter, and increment whenever a request is sent:
import "go.opentelemetry.io/otel/metric"

socialMediaAPIRequestCounter, _ := meter.Int64Counter(
	"some.prefix.api.requests",
	metric.WithDescription("Number of sent Social Media API requests"),
)
// Your secret sauce code does things here
socialMediaAPIRequestCounter.Add(ctx, 1)
A simple example, but you can see we are incrementing the counter each time our secret sauce code runs. Lets do another very quick example with a Histogram:
import "go.opentelemetry.io/otel/metric"

opHistogram, _ := meter.Int64Histogram(
	"some.prefix.process.image.duration",
	metric.WithDescription("Duration of image enhancement"),
)

t1 := time.Now()
op(ctx)
dur := time.Since(t1)

opHistogram.Record(ctx, dur.Microseconds())
That example is showing the time it takes to do an image enchancement in our CSI: New York image enchancement app.

Lets cover one last example of cache hit rates, because we are using CounterObserver which if we remember correctly is used to instrument monotonic numbers that are additive/summable:
import "go.opentelemetry.io/otel/metric"

counter, _ := meter.Int64ObservableCounter("some.prefix.request.cache")

// Arbitrary key/value labels.
hits := []attribute.KeyValue{attribute.String("type", "hits")}
misses := []attribute.KeyValue{attribute.String("type", "misses")}
errors := []attribute.KeyValue{attribute.String("type", "errors")}

if _, err := meter.RegisterCallback(
	func(ctx context.Context, o metric.Observer) error {
		stats := cache.Stats()

		o.ObserveInt64(counter, stats.Hits, metric.WithAttributes(hits...))
		o.ObserveInt64(counter, stats.Misses, metric.WithAttributes(misses...))
		o.ObserveInt64(counter, stats.Errors, metric.WithAttributes(errors...))

		return nil
	},
	counter,
); err != nil {
	panic(err)
}
We should also note that CounterObserver is an asynchronous instrument, and that means it will periodically invoke a callback function to collect measurements. They were very basic examples that I have provided, but hopefully in the future I can link a repository with some better and more fleshed out real-world examples.
The last step is to choose a backend to send your timeseries metrics to, but as mentioned previously we will cover centralised observability platforms in a later post.
Wrap Up Part Deux
A recap of the advice and guidance I have given in this post:
- Metrics are incredibly useful, and don’t let anyone tell you otherwise. I can share countless stories on the importance of having dashboarded data points during late-night troubleshooting sessions while on-call.
- Choose OpenTelemetry to model, transport, and store your metrics. You can’t go wrong by making this choice early on.
- Learn the basics of the anatomy of an OpenTel metric, and familiarise yourself with the instrument types to help you make informed decisions on which instruments to pick for your requirements.
Thank you so much for reading, and as always, I hope this post was helpful! Keep an eye out for my next post on Tracing and APM!